Author Archives: wagamama

Bonded Internet

A quick post for people who rely on ADSL connections for their Internet.

If you need more power take a look at iTel, they offer a bonded Internet connection where you can bond up-to 6 connections for ‘mega bandwidth’.

300 Fiber

I’m happy to say I currently enjoy a 300 meg fiber connection (yes, I’m bragging) so I don’t have a need for bonded ADSL now but perhaps in the future.

How bonded ADSL work?

Bonded ADSL is where multiple ADSL lines are combined into a single aggregated connection to deliver greater download and upload speeds. This is not the same as using a load balancing router with multiple connections.

With bonding, the original datastream is split up into multiple streams, each of which is sent down an individual ADSL connection. The process of splitting datastreams is performed by special hardware at the bonded ADSL provider’s datacentre. At the customer’s premises, the separate datastreams are recombined to form a single data stream.

A super cool way to increase your bandwidth when only ADSL is available.

WTB: Supermicro SuperServer 2015TA-HTRF

It was back in 2011 when Supermicro released the 2015TA-HTRF.

Supermicro 2015TA-HTRFIt is a 2U rack mount fat twin. It contains hot swap modules with two Atom-based computers. In total, you get 8 Atom computers and 24 2.5 inch hot-swap hard drive bays.

I want to build a Ceph cluster and of all the hardware I have seen this looks like it would be the most cost effective. Since I love buying used hardware this is what I would like to get.

The problem is, it must not have been a big seller. I have been unable to find even a single used unit for sale… I’ll keep watching eBay but do not have very high expectations in finding these 🙁

My next low budge rack. SuperServer 2026TT-H6RF

Check out the 2U – 4 node servers the Supermicro SuperServer 2026TT-H6RF. Nice looking upgrade from the servers I have been using and they are very cheap (like $200) on eBay as of June 2016.

This is mostly a note to self, and anyone else who builds racks based on off-lease servers.

Learned about these when I found some link to them while reading ServeTheHome.

Common – where are MySQL impressive numbers?

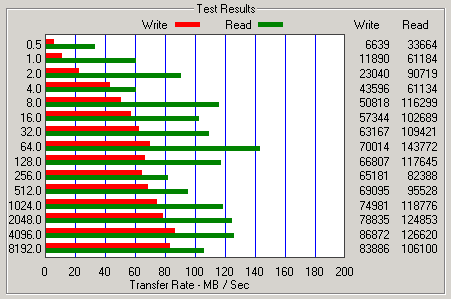
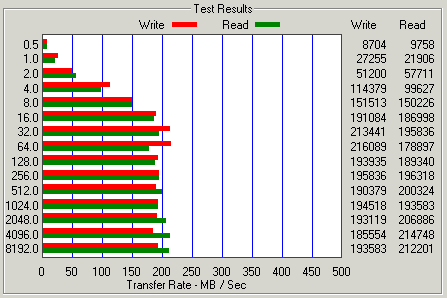
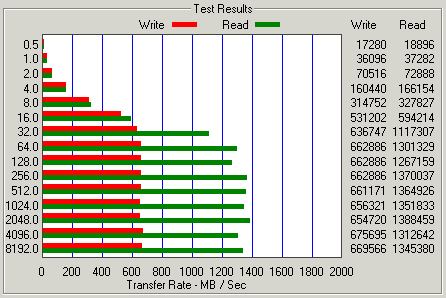
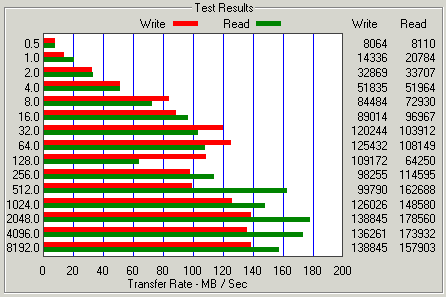
I always read about blazing performance of MySQL, how many millions of transactions it can do per second when using a cache, SSD, Fusion-IO or whatever. Check out some of these reports:

RAID vs SSD vs FusionIO

FusionIO – time for benchmarks

Testing Fusion-io ioDrive

Fusion-io Tweaks Flash To Speed Up MySQL Databases

I like big numbers and faster this and faster that, who doesn’t. I’ve tried Fusion-IO cards, I’ve tried SSD, I’ve tried normal hard drives with PCI SSD as a cache using Intel CAS. Bottom line, nothing works to improve the performance in any significant way.

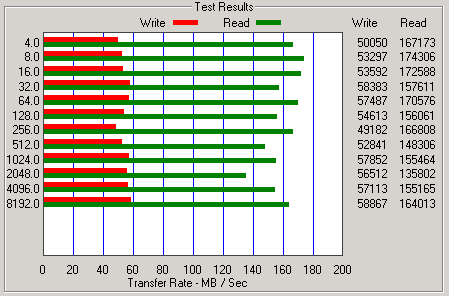
If I test with a lab testing tool, or benchmark test it will report an Fusion-IO, SSD or Intel CAS have the potential to provide speed improvements. What about a real world test? That is where I want to see a difference. When I am doing a database restore on of a MySQL server, I would like to see something actually impact the restore times. In reality on a 8 core machine only one core is used since the default restore can only run as a single process.

I read recently about disabling hyper threading on the CPU may actually give MySQL a boost. I also read about innodb_doublewrite in MySQL (dangerous, not recommended to use).

Lets run a few tests under different situations. I am going to restore a 3gb database with about 11.9 million records. This is not benchmark software, I want to see changes in real life.

Each restore is run twice and the average if the two runs used.

Testing with 4 cores (hyper-threading disabled)

Intel CAS disabled – 27.25 minutes

Intel CAS enabled – write through cache 29.10 minutes.
Intel CAS enabled – write back cache 27.18 minutes

So none of this seems to make any major difference. Perhaps the disk is not the bottleneck. Lets try another approach to the testing.

Conduct the same tests, but rather than performing a single restore we will restore four instances of the database simultaneously… Lets see what happens…

Intel CAS disabled – 1 hour 33 minutes

Intel CAS enabled – write through cache 1 hour 34 minutes
Intel CAS enabled – write back cache 43 minutes

Finally some improvement. That represents a 100% speed increase when using Intel CAS software, increasing the stress on the disks does show some improvement as a of the caching.

So the best performance comes from putting some pressure on the disk system, only then does the cache start to show some benefit.

Next, a quick test with SQL’s skip-innodb_doublewrite feature enabled (or I should say disabled).

So disable the innodb_doublewrite feature, leaving the Intel CAS inabled with write back caching and restoring 4 copies of the same database simultaneously… Lets see what happens…

Intel CAS enabled – write back cache 26 minutes

Nice! While turning off innodb_dobulewrite is not safe (at all!) for production, if you are trying to recover from a disaster situation and need to restore a large database (or several large databases) turning it off can certainly reduce your recovery time.

I’m curious, lets see our restore time with innodb_doublewrite turned off, but only restoring a single copy of the database.

Intel CAS enabled – write back cache 19 minutes

Intel Cache Acceleration Software – v3 is out!!

I have been waiting for this, because I had previously read that version 3 would introduce (the dangerous) feature of write-back caching.

It is dangerous because if the server crashes or looses power and the writes in the cache have not been written to the disk you will have inconsistent data…. that’s bad.

So, lets do a few tests.

The Testing Environment

Here is the hardware setup of the server being used for the benchmark tests.

Motherboard: Supermicro
OS: Windows Server 2008 R2
Processor: Dual Intel Xeon L5420 @ 2.50 GHz
System RAM: 32 GB
Storage Controller: Intel ESB2 SATA RAID controller (driver 10.1.5.1001)
Spinning Disks: Seagate Laptop 1tb (ST1000LM014)
Spinning Disk Setup: RAID 10 (4 disks)
Cache Device: Kingston Digital HyperX Predator 240 GB PCIe Gen2 x4 Solid State Drive

FIRST TEST

Restore a 205gb MySQL database, that is a lot of writes to the disk. Lets see if the write cache makes any difference, in theory it should.

#1 – Cache off, source and destination on same disk: 6 hours 22 minutes
#2 – Cache on (write-back enabled), source and destination on same disk: 6 hours 30 minutes
#3 – Cache on (write-back enabled), source SMB network share: 7 hours 7 minutes

The hard drives in RAID 10 can write at less than 200 MB/sec and the cache device can write at more than 650 MB/sec —- yet the performance drops slightly? We should ideally be seeing a massive increase in performance.

How can the results actually be slower when using the cache?

SECOND TEST

Intel provides a tool called Intel IO Assessment Tool, you run it on your system and it will determine if your system can benefit from the cache and what files you should be caching.

The results say I could benefit and the files I should be caching are the MySQL data folder. No surprise since the server is strictly a MySQL server.

IOPS

Lets use Iometer to calculate how many IOPS this hardware setup can produce. The tests are conducted using the OpenPerformanceTest16.icf (16GB) config from http://vmktree.org/iometer/. The specific test used was RealLive-60%Rand-65%Read.

Kingston Digital HyperX Predator (systems cache drive)
I/Os per Second: 8,346
MBs per second: 68.38 MBPS
Average I/O Response Time: 5.25 ms

Seagate Laptop (RAID 10) – Intel CAS enabled: NO
I/Os per Second: 150
MBs per second: 1.23 MBPS
Average I/O Response Time: 350.20 ms

Seagate Laptop (RAID 10) – Intel CAS enabled: YES
I/Os per Second: 1424
MBs per second: 11.67
Average I/O Response Time: 34.22

This test shows that Intel CAS is working, with nearly a 9.5x improvement over going direct to the disk. Yet no measurable improvement in the performance of MySQL?

FINAL RESULTS

The results of all tests I have done with Intel CAS have been disappointing to say the least. The new version 3 has no options to set, so I can’t really be screwing anything up.

I am going to reach out to Intel and see if they can provide any insight as to why I am not seeing any benefit in my real life usage.

Intel ESB2 SATA RAID Controller Drivers

Intel Raid ControllerIt is February 2016. I am trying to find Windows drivers for an ‘antique’ Intel RIAD controller, the ESB2 SATA RAID card.

This card is accessable through the system BIOS and Windows 2012 R2 installs OK, but I can’t see the status of my RAID drives when in Windows. Is my array OK?

I started a search and tried to install drivers from Intel. Their Intel RST page says it has drivers that support Windows 2012 R2 but when trying to install I am told the platform is not supported.

I came to learn the last version of Intel drivers to support the ESB2 SATA RAID card is version 10.1.5.1001.

After doing some Google searching I found an installer for version 10.1.5.1001. Bingo, they install and it works. If you want to grab the Intel drivers yourself, we are keeping a copy here. Intel_Rapid_Storage_10.1.5.1001

Prior to the install the driver the card was using was Intel 8.6.2.1315 with a date of June 8, 2010. Now Windows is reporting version 10.1.5.1001 with a date of February 18, 2011.

Now with the Intel Rapid Storage Technology software available on the OS, I can enable/disable the write-back disk cache on my storage array. Dangerous? Yes. Faster? Yes. Will I do it? Probably.

Intel Cache Acceleration Software – Performance Test

Intel LogoI am attempting to boost the performance of some spinning disks by using Intel Cache Acceleration Software.

Using a write through process the software can place the contents of folders/files you specify in cache. When the file is next requested it can be quickly pulled from the cache rather than going to the slow spinning disk. This can result in major speed improvements of disk reads. Great for caching spinning disk content or network based storage.

In my specific case I have a fairly small amount of cache, only 124 gigs of PCIe SSD storage. I am allocating 100% of that space to cache the MySQL data folder, which in theory is making 100% of my database available from the cache because my data folder holds only 116 gigs of data.

The software integrates into Windows Performance Monitor so you can easily view how much data is in the cache, the % Cache Read Hits/sec and other good stuff.

While monitoring those stats and doing queries against the database, perf mon was not showing hits to the cache… what’s going on? Time to investigate and benchmark a few things.

There is really no configuration options in the caching software. The only setting is something called 2 Level Cache and you can select on or off – that’s it. There is not much information about what that is for, and it is not intuitive based on the label.

I am going to run three simple tests, which should reveal how much of a performance the cache makes and if I am better off running with this 2 Level Cache on or off.

Test #1
Restore & Backup 96gb Database With No Caching

Restore Time: 5 hours 49 minutes
Backup Time: 1 hour 03 minutes

Test #2
Restore & Backup 96gb Database With Caching – Level 2 Cache Off

Restore Time: 5 hours 56 minutes
Backup Time: 0 hours 53 minutes

Test #3
Restore & Backup 96gb Database With Caching – Level 2 Cache On

Restore Time: 6 hours 07 minutes
Backup Time: 0 hours 53 minutes

The purpose of the restoration before the backup is to give the cache time to populate. In theory all the database data on disk should be available to the cache, however I have no way to verify that it is all in cache or not.

The results? WOW! Can you say disappointed? What is going on here?

2.5 Inch Drives Are Not Quick

What can you do if you need high performance, only have 2.5 inch drive slots and can’t afford SSD?

Last year I built two servers using WD Red drives running in RAID 10. The performance is not that great and also not very consistent.

This year I built two more of the same servers, but wanted to equip them with Seagate Laptop SSHD disks which are a hybrid spinning disk/SSD with 8gb of SSD type memory. They cost a few dollars more, about $10 more at the time of this posting.

Reading benchmarks online before buying them, they should be faster than the WD RED drives… but the downside is they are not specifically designed for RAID based systems (does that matter?).

First up, WD Red:

Maximum Read: 143MB/sec
Maximum Write: 86MB/sec

raid10-bench

Next, Seagate Laptop SSHD:

Maximum Read: 214MB/sec
Maximum Write: 193MB/sec

segate-sshd

Overall, quite a big performance boost. I am really hoping that it helps with the write speed since the workload is just about all write.

I found doing file copies from an SSD over to the Seagate Hybrid drive in Windows was reporting write speeds of 400MB/Sec when coping a 90 gig file. That was very impressive.

To add some extra boost to these old servers I also equipped them with Kingston HyperX Predator 240 GB PCIe sold state drives. Using 100 GB of those drives as a boot device and the balance as a read cache for MySQL data which is stored on the Seagate RAID 10 drives.

How does the HyperX Predator perform in a benchmark test? Lets take a look.

Maximum Read: 1,388MB/sec
Maximum Write: 675MB/sec

HyperX

Those are certainly some big numbers, looking forward to the price coming down so we can get a few TB of speeds like that.

WD Red Drives – Inconsistent Performer

I have two servers, each with WD Red 2.5 1tb hard drives. The servers run 4 drives in RAID 10 configuration.

I had previously benchmarked them with ATTO’s Disk Benchmark software on two different occasions. I thought it was strange to get different results. Today I was doing another benchmark and again got a 3rd set of results.

Here are the dates and different results I have received.

August 29, 2014

Maximum Read: 162MB/Sec
Maximum Write: 135MB/Sec

raid-10

April 7, 2015

Maximum Read: 174MB/Sec
Maximum Write: 58MB/Sec

RAID 10 - Slow

September 5, 2015

Maximum Read: 143MB/Sec
Maximum Write: 70MB/Sec

raid10-bench

Why so much variance in the results? Really strange…

I suspect the results from April 7, 2015 are probably ‘off’ as the write speed sorta flat lining around 55MB/Sec seems too consistent.

If you just go with the average (maximums) from the other two you get:

Maximum Read: 152MB/Sec
Maximum Write: 102MB/Sec

Windows fails to see Autounattend.xml from ISO

I’m working on setting up a bunch of servers, so I used the Windows System Image Manager to create an image with answers to all the questions of a basic install.

I used VMWare to boot the ISO image I was creating to test.

Placing the autounattended.xml on the root of the DVD ISO gets the image in VMWare fully setup.

Try it out on the actual server and nothing works. I am prompted just like a normal install. It is not reading the autounattended.xml file at all.

Turns out the autounattended.xml file will only work if the BIOS considers the device removable, like a USB thumb drive or something. The BIOS I am using is mounting the ISO as a fixed disk so the Windows installer will not use the autounatteended.xml that lives in the root of the ISO.

Good news, there is a solution to this problem of the Autounattended.xml not being picked up by the installer. The process inegrates the Autounattended.xml into the boot.wim file so it is always picked up.

You need the following items beforehand:

  • WAIK
  • The USB or ISO disk you plan to make your install disk

Then do these steps:

Mount the boot.wim image located on your USB HDD disk (in this example H: is the USB disk) using ImageX from WAIK

imagex /mountrw H:\Sources\boot.wim 2 C:\temp

(assumes you have a folder “C:\Temp”)

(the number 2 stands for Index 2 within the boot.wim image)

Fire up your Windows Explorer and navigate to C:\Temp. You will see your boot.wim image mounted and all. Drop your “autounattend.xml” file you created directly into this folder (right next the the Setup.exe file)

Close Windows Explorer and unmount the image:

imagex /unmount /commit c:\temp