Category Archives: server

Rspamd Tips & Tricks


Rspamd is supposed to be a high performance spam filtering solution. Of any project I have worked with, it has the worst documentation of anything I have used. Obviously this is the reason the product has not been widely adopted. You may have the best software in the world, but if no one can figure out how to use it…

View Stats

rspamc stat

Command will output some details, including how many messages scanned with a breakdown of classifications. Also lists details of fuzzy hashes and bayes information.

View Configuration

rspamadm configdump

Command will dump out the active configuration of rspamd. Very useful since rspamd uses a general configuration file, then has local configuration files that merge and also override configuration that replaces default configuration.

You can drill down and look at individual specific configuration element (there are many), here are a few examples.

rspamadm configdump logging
rspamadm configdump regexp
rspamadm configdump classifier

External Sites

The following links are places I have found with good general information or documentation on RSPAMD.

0xf8.org

Temperature Testing Odroid-C2 Aluminum Case

I really like the ODROID-C2 by HardKernel, they are very reliable, have a quality network card, lots of RAM and really perform incredibly well when used with eMMC flash storage.

I have three of them and all have performed so well I am going to deploy them to data centers to act as DNS servers.

Need a case for that… hmmm… how about Cogent Design’s all aluminum case. Keep the little board very safe and cool by replacing the stock heat sink with the entire case to act as the cooling system.

I’m going to run a couple ‘very scientific’ tests to measure the performance of the case vs. the stock cooler that comes on the board.

Tested side by side with an ambient room temperature of 21.5°C (70.7°F), there is no fan in the room. Both units are powered from the same USB power supply.

The OS is Armbian Debian (jessie) 3.14.79 on both nodes, there is nothing active on the machines just the base OS.

Stock vs. Aluminum

After about 25 minutes running at idle the stock cooler comes in at 40°C and the aluminum case comes in at 36°C. Not a massive difference, but it is cooler. To the touch both the cooler and the case are warm but not too hot.

Stock cooler at idle
Aluminum case at idle

Heat It Up

I used the Linux stress program to apply a bit of heat to the computers. The following command was run for about 1.5 hours to see how high the temperatures would climb.

stress --cpu 4

Amazingly both computers did not heat up very much. They both stayed much cooler than I expected they would with the stock cooler climbing to 60°C and the aluminum case only reaching 55°C. Perhaps the stock cooler climbed only to 60°C because it itself is not in a case, but I have no case to test it with.

Stock cooler reaches 60°C
Aluminum case reaches 55°C

Testing Against Each Other

Since I have three of these devices, I purchased three cases. While the temperatures observed above are low, does the case really keep the machine cool enough?

Maybe I used too much thermal paste, or maybe not enough?

I performed a few tests with all cases, using different amounts of thermal compound. The result was they all performed the same.

Suggestions For Possible Improvement

One difference I see between the aluminum case and the stock CPU cooler is surface area. I’m no math mathematician but I suspect the stock cooler may have a similar amount of surface area because of all fins despite it only measuring 43cm x 33cm.

From looking at the case I would suggest too Cogent Design for a v3 of this case, consider keeping more material from the lid of the case. It seems to me that more material is being removed from inside the lid than needs to be.

Then increase surface area, produce ridges for fins on the outside of the case where possible. Even if a ridge was only 1mm in depth it adds a lot more surface area for cooling – just like traditional CPU coolers. No one produces a CPU cooler that is a solid block of aluminum, maximizing the surface area maximizes the cooling performance.

As a solid block of aluminum the CPU is heating up the aluminum block but without more surface area the ability dissipate that heat is limited.

I really noticed the difference between the stock cooler and the aluminum case when the stress test ended. The stock cooler was able to lower its temperature much quicker, which I attribute to the surface area of the stock cooler.

Would I Purchase Again

Would I purchase this case again if I was looking for another case? Yes, I would purchase the case again – hopefully version 3 will be available should I need a few more in the future.

Can Amazon AWS win this time?

I have previously written two posts about the cost of using Amazon AWS, one way back in May 2010 and one in August 2015. In both cases the costs involved with running a rack full of servers 24/7 365 was much more expensive than we could do it ourselves hosting equipment in a data center.

A project I’m working on is growing and we have a couple options that we are considering. Our volume increases a lot during USA working hours, specifically Monday – Friday 8am – 1pm. We are considering the following two options:

1) Provision Amazon EC2 servers during peak times, so 5 hours a day and 5 days a week.
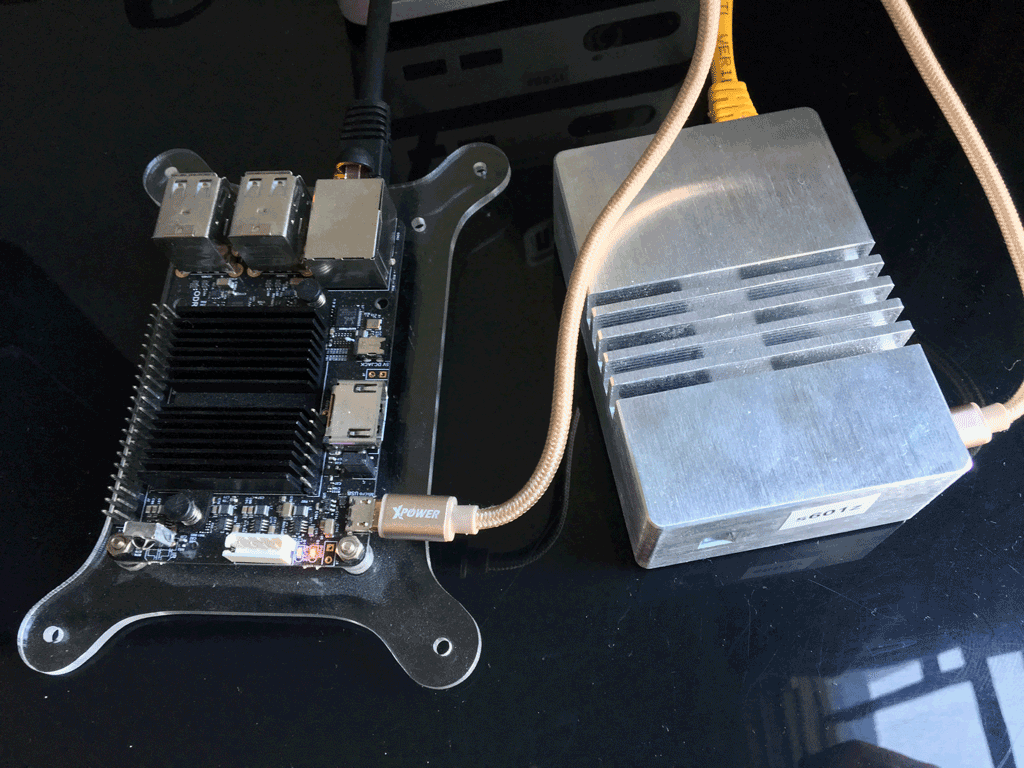
2) Purchase a bunch of Intel NUC DC53427HYE computers. These is not server grade hardware, but they do have vPro technology which allows them to be remotely managed.

We have purchased 1 of these little Intel NUC machines for testing, purchased new in the box for $180 – plus shipping so about $200 for the base unit. We need 4gb of RAM and 120gb of disk space.

Configured the NUC is costing about $290 ($200 NUC + $60 SSD + $30 RAM). 10U at our data center with 20 amps of power and 30Mbps bandwidth. We should easily be able to power 30 of these little NUC machines with 20 amps of power. The data center space will cost $275 per month, for 24/7 operation with 30Mbps of bandwidth based on 95th percentile usage.

Lets run some CPU benchmarks on these little guys and see how much Amazon cloud hosting would cost us for the same compute power running only 5×5. It should be a lot cheaper to go the Amazon route… but lets find out.

The pricing / servers have not changed much since I ran the benchmarks last year. These benchmark were run in Amazon US West (Oregon) using Performance Test 9.0, which is a different version than last year so the scores are a bit different.

Instance Type:

c4.large – 8 ECU – 2 vCPU – 3.75gb RAM – $0.193 per Hour

Windows Server 2016
CPU Mark: 2,925
Disk Mark: 791 (EBS Storage)

Intel NUC DC53427JUE – Intel i5-3427u – 4gb RAM

Windows 10 Pro
CPU Mark: 3,888
Disk Mark: 3,913 (Samsung 840 EVO 120gb mSATA SSD)

Wow, the benchmark performance for the Amazon instance is quite a bit lower than the basic Intel NUC.

The total CPU score of 30 of these Intel NUC servers would would be 116,640. To get the same computer power out of the c4.large instance at Amazon we would need to boot up 40 instances.

Lets run the costs at Amazon. We would need 40 servers at .193 cents per hour. We need them for 5 hours a day, 20 days a month. So the math looks like this.

40 servers x 0.193 = $7.72 an hour
$7.72 x 5 hours = $38.60 per day
$38.60 x 20 days = $772 per month

In addition we need to take into consideration the load balancer, bandwidth and storage. We are using an estimate of 3,300 GB per month inbound and outbound to get our estimated pricing, this is only a fraction of the total bandwidth we could theoretically move on our 30Mbps line from the data center.

Load Balancer Pricing
$0.025 per hour = 5 hours x 20 days = 100 hours = $2.50 per month
$0.008 per GB = $0.008 x 3,300 = $26.40 per month

Bandwidth Pricing
3,300 gigs outbound bandwidth = $297 per month

Storage
Sorry Amazon, your pricing is so complex I can’t even figure out how much the disks are going to cost to provision 120gigs per machine for the 5 hours x 5 days operation…

So a rough cost is going to be somewhere in the range of $1,100 per month for only 5 hours a day, 5 days a week.

Lets look at a 1 year investment.

Amazon = $13,200 per year

Buying 30 Intel NUC servers and hosting them.

Intel NUC x30 = $8,700
Hosting = $275 x 12 months = $3,300

Total to buy and host 1 year = $12,000 for 1st year

Paying for the hardware up front, running the servers 24/7 still comes out cheaper than going to the cloud with usage of only 5 hours a day and 5 days a week.

Lets lengthen the time to 2 years.

Amazon = $26,400
Own & Host = $15,300

And the 3 year view?

Amazon = $39,600
Own & Host = $18,600

Incredible, I thought going to the cloud would be more cost effective than buying and hosting our own equipment when we only need the extra capacity for a limit amount of time per day.

Message Delivery Testing with Exim

Email DeliveryI was recently doing some troubleshooting of email delivery on an Exim server.

I wanted to see what happens when the server attempts delivery. The error in the logs was a timeout, but it does not tell you when in the process the timeout happens.

Brad the Mad has a nice Exim Cheatsheet online that gives some examples of how to manage an Exim server.

Expanding on some of his examples I used this command:

exim -v -M 

That command will force Exim to attempt a delivery of the message you define as the message-id. The addition of -v will show every step of the process, very handy.

In my test using this tool, the delivery failed. In fact, it could not even connect to the remote server at all. Yet, if I did a telnet command like this:

telnet 123.345.679.123 25

I could connect to the remote server. After some digging, I found the exim.conf file was using a command on the transport to bind the outbound connections to an IP address on the server other than the default IP.

interface      = <; 192.168.123.123

The network then had special rules on the firewall to direct outbound traffic from that IP address to a specific public IP address.

So my telnet command that was giving me a positive result, I could connect to the remove server but only because my test was not simulating the same outbound IP address as the server.

If you need to telnet out of a server and bind to a specific IP address, you can do it like this:

telnet -b   

WTB: Supermicro SuperServer 2015TA-HTRF

It was back in 2011 when Supermicro released the 2015TA-HTRF.

Supermicro 2015TA-HTRFIt is a 2U rack mount fat twin. It contains hot swap modules with two Atom-based computers. In total, you get 8 Atom computers and 24 2.5 inch hot-swap hard drive bays.

I want to build a Ceph cluster and of all the hardware I have seen this looks like it would be the most cost effective. Since I love buying used hardware this is what I would like to get.

The problem is, it must not have been a big seller. I have been unable to find even a single used unit for sale… I’ll keep watching eBay but do not have very high expectations in finding these 🙁

My next low budge rack. SuperServer 2026TT-H6RF

Check out the 2U – 4 node servers the Supermicro SuperServer 2026TT-H6RF. Nice looking upgrade from the servers I have been using and they are very cheap (like $200) on eBay as of June 2016.

This is mostly a note to self, and anyone else who builds racks based on off-lease servers.

Learned about these when I found some link to them while reading ServeTheHome.

Intel Cache Acceleration Software – v3 is out!!

I have been waiting for this, because I had previously read that version 3 would introduce (the dangerous) feature of write-back caching.

It is dangerous because if the server crashes or looses power and the writes in the cache have not been written to the disk you will have inconsistent data…. that’s bad.

So, lets do a few tests.

The Testing Environment

Here is the hardware setup of the server being used for the benchmark tests.

Motherboard: Supermicro
OS: Windows Server 2008 R2
Processor: Dual Intel Xeon L5420 @ 2.50 GHz
System RAM: 32 GB
Storage Controller: Intel ESB2 SATA RAID controller (driver 10.1.5.1001)
Spinning Disks: Seagate Laptop 1tb (ST1000LM014)
Spinning Disk Setup: RAID 10 (4 disks)
Cache Device: Kingston Digital HyperX Predator 240 GB PCIe Gen2 x4 Solid State Drive

FIRST TEST

Restore a 205gb MySQL database, that is a lot of writes to the disk. Lets see if the write cache makes any difference, in theory it should.

#1 – Cache off, source and destination on same disk: 6 hours 22 minutes
#2 – Cache on (write-back enabled), source and destination on same disk: 6 hours 30 minutes
#3 – Cache on (write-back enabled), source SMB network share: 7 hours 7 minutes

The hard drives in RAID 10 can write at less than 200 MB/sec and the cache device can write at more than 650 MB/sec —- yet the performance drops slightly? We should ideally be seeing a massive increase in performance.

How can the results actually be slower when using the cache?

SECOND TEST

Intel provides a tool called Intel IO Assessment Tool, you run it on your system and it will determine if your system can benefit from the cache and what files you should be caching.

The results say I could benefit and the files I should be caching are the MySQL data folder. No surprise since the server is strictly a MySQL server.

IOPS

Lets use Iometer to calculate how many IOPS this hardware setup can produce. The tests are conducted using the OpenPerformanceTest16.icf (16GB) config from http://vmktree.org/iometer/. The specific test used was RealLive-60%Rand-65%Read.

Kingston Digital HyperX Predator (systems cache drive)
I/Os per Second: 8,346
MBs per second: 68.38 MBPS
Average I/O Response Time: 5.25 ms

Seagate Laptop (RAID 10) – Intel CAS enabled: NO
I/Os per Second: 150
MBs per second: 1.23 MBPS
Average I/O Response Time: 350.20 ms

Seagate Laptop (RAID 10) – Intel CAS enabled: YES
I/Os per Second: 1424
MBs per second: 11.67
Average I/O Response Time: 34.22

This test shows that Intel CAS is working, with nearly a 9.5x improvement over going direct to the disk. Yet no measurable improvement in the performance of MySQL?

FINAL RESULTS

The results of all tests I have done with Intel CAS have been disappointing to say the least. The new version 3 has no options to set, so I can’t really be screwing anything up.

I am going to reach out to Intel and see if they can provide any insight as to why I am not seeing any benefit in my real life usage.

Intel ESB2 SATA RAID Controller Drivers

Intel Raid ControllerIt is February 2016. I am trying to find Windows drivers for an ‘antique’ Intel RIAD controller, the ESB2 SATA RAID card.

This card is accessable through the system BIOS and Windows 2012 R2 installs OK, but I can’t see the status of my RAID drives when in Windows. Is my array OK?

I started a search and tried to install drivers from Intel. Their Intel RST page says it has drivers that support Windows 2012 R2 but when trying to install I am told the platform is not supported.

I came to learn the last version of Intel drivers to support the ESB2 SATA RAID card is version 10.1.5.1001.

After doing some Google searching I found an installer for version 10.1.5.1001. Bingo, they install and it works. If you want to grab the Intel drivers yourself, we are keeping a copy here. Intel_Rapid_Storage_10.1.5.1001

Prior to the install the driver the card was using was Intel 8.6.2.1315 with a date of June 8, 2010. Now Windows is reporting version 10.1.5.1001 with a date of February 18, 2011.

Now with the Intel Rapid Storage Technology software available on the OS, I can enable/disable the write-back disk cache on my storage array. Dangerous? Yes. Faster? Yes. Will I do it? Probably.

Intel Cache Acceleration Software – Performance Test

Intel LogoI am attempting to boost the performance of some spinning disks by using Intel Cache Acceleration Software.

Using a write through process the software can place the contents of folders/files you specify in cache. When the file is next requested it can be quickly pulled from the cache rather than going to the slow spinning disk. This can result in major speed improvements of disk reads. Great for caching spinning disk content or network based storage.

In my specific case I have a fairly small amount of cache, only 124 gigs of PCIe SSD storage. I am allocating 100% of that space to cache the MySQL data folder, which in theory is making 100% of my database available from the cache because my data folder holds only 116 gigs of data.

The software integrates into Windows Performance Monitor so you can easily view how much data is in the cache, the % Cache Read Hits/sec and other good stuff.

While monitoring those stats and doing queries against the database, perf mon was not showing hits to the cache… what’s going on? Time to investigate and benchmark a few things.

There is really no configuration options in the caching software. The only setting is something called 2 Level Cache and you can select on or off – that’s it. There is not much information about what that is for, and it is not intuitive based on the label.

I am going to run three simple tests, which should reveal how much of a performance the cache makes and if I am better off running with this 2 Level Cache on or off.

Test #1
Restore & Backup 96gb Database With No Caching

Restore Time: 5 hours 49 minutes
Backup Time: 1 hour 03 minutes

Test #2
Restore & Backup 96gb Database With Caching – Level 2 Cache Off

Restore Time: 5 hours 56 minutes
Backup Time: 0 hours 53 minutes

Test #3
Restore & Backup 96gb Database With Caching – Level 2 Cache On

Restore Time: 6 hours 07 minutes
Backup Time: 0 hours 53 minutes

The purpose of the restoration before the backup is to give the cache time to populate. In theory all the database data on disk should be available to the cache, however I have no way to verify that it is all in cache or not.

The results? WOW! Can you say disappointed? What is going on here?

2.5 Inch Drives Are Not Quick

What can you do if you need high performance, only have 2.5 inch drive slots and can’t afford SSD?

Last year I built two servers using WD Red drives running in RAID 10. The performance is not that great and also not very consistent.

This year I built two more of the same servers, but wanted to equip them with Seagate Laptop SSHD disks which are a hybrid spinning disk/SSD with 8gb of SSD type memory. They cost a few dollars more, about $10 more at the time of this posting.

Reading benchmarks online before buying them, they should be faster than the WD RED drives… but the downside is they are not specifically designed for RAID based systems (does that matter?).

First up, WD Red:

Maximum Read: 143MB/sec
Maximum Write: 86MB/sec

raid10-bench

Next, Seagate Laptop SSHD:

Maximum Read: 214MB/sec
Maximum Write: 193MB/sec

segate-sshd

Overall, quite a big performance boost. I am really hoping that it helps with the write speed since the workload is just about all write.

I found doing file copies from an SSD over to the Seagate Hybrid drive in Windows was reporting write speeds of 400MB/Sec when coping a 90 gig file. That was very impressive.

To add some extra boost to these old servers I also equipped them with Kingston HyperX Predator 240 GB PCIe sold state drives. Using 100 GB of those drives as a boot device and the balance as a read cache for MySQL data which is stored on the Seagate RAID 10 drives.

How does the HyperX Predator perform in a benchmark test? Lets take a look.

Maximum Read: 1,388MB/sec
Maximum Write: 675MB/sec

HyperX

Those are certainly some big numbers, looking forward to the price coming down so we can get a few TB of speeds like that.